Paper of the month: A Detailed Look at the First Results from the Large Underground Xenon (LUX) Dark Matter Experiment
March 7, 2014 by admin
Although the existence of dark matter is largely undisputed, we still long for a convincing direct observation of it. The Large Underground Xenon experiment (LUX) was built for that purpose. It is a detector consisting of a two-phase xenon timeprojection chamber, with two photo-multiplier tube (PMT) arrays, top and bottom. LUX is currently operating about a mile underground at the Sanford underground laboratory.
Theoretically, a dark matter particle, a relic from the immemorial times which is travelling erratically through the universe, could hit a xenon nucleus in the detector, recoiling it. In the process, two important things happen: the scattering produces light, and ionizes the media. The amount of light and ionization produced are called scintillation and ionization yields, and are represented by the S1 and S2 signals detected by the PMTs. The ratio S2/S1 is what distinguish nuclear recoils (signal) from electron recoils (backgrounds).
After 85.3 live-days, with a fiducial mass of 118 kg of liquid xenon, a total of 160 events were recorded, being completely consistent with electron recoil background, that is, no dark matter scattering was observed up to now. Interpreting this result as a limit on weakly interacting massive particles as dark matter (WIMPs), this puts a strong bound on the dark matter mass and coupling, specially at low masses, revealing a tension between the LUX result and claims of observation of dark matter scattering, namely, the DAMA/LIBRA, CoGeNT, CDMS II, and CRESST results.
In order to determine how the detector reacts to interactions at different energies, and low energies in particular, a calibration must be made with a known radioactive source. In this case, a tritium source has been used. This novel solution has allowed LUX to obtain high, and reliable statistics for these crucial low energies and consequently resulted in good background approximations in this region of energy.
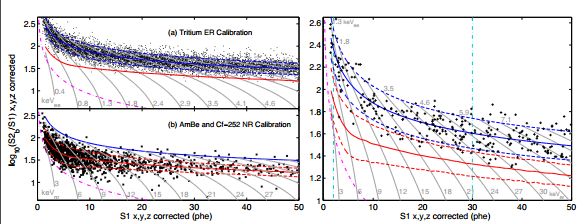
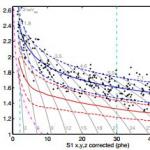
Caption: Left: Calibrations of detector response in the 118 kg fiducial volume. The ER (tritium, panel a) and NR (AmBe and 252Cf, panel b) calibrations are depicted, with the means (solid line) and ±1.28 contours (dashed lines). This choice of band width (indicating 10% band tails) is for presentation only. Panel a shows fits to the high statistics tritium data, with fits to simulated NR data shown in panel b, representing the parameterizations taken forward to the profile likelihood analysis. The ER plot also shows the NR band mean and vice versa. Gray contours indicate constant energies using an S1–S2 combined energy scale (same contours on each plot). The dot-dashed magenta line delineates the approximate location of the minimum S2 cut. Right: LUX WIMP signal region. Events in the 118 kg fiducial volume during the 85.3 live-day exposure are shown. Lines are as shown on the left, with vertical dashed cyan lines showing the 2–30 phe range used for the signal estimation analysis.
As no events were observed above the expected background levels, only a limit can be placed on the cross-section of dark matter. Currently, LUX is the most sensitive direct detection experiment to date, and thus has produced the lowest limits. It will continue to collect data into the future to further probe into the unknown.
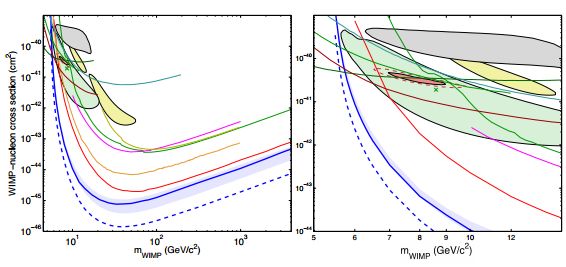
Caption: Left: The LUX 90% confidence limit on the spin-independent elastic WIMP-nucleon cross-section (solid blue line) and 300-day projected sensitivity (dashed blue), together with the ±1 sigma variation from repeated trials, where trials fluctuating below the Poisson limit from a background-free experiment recording zero counts are forced to 2.3 events (blue shaded). We also show Edelweiss II (dark yellow line), CDMS II (green line), ZEPLIN-III (magenta line), CDMSlite (dark green line), XENON10 S2-only (brown line), SIMPLE (light blue line), and XENON100 100 live-day (orange line) and 225 live-day (red line) results. Right (zoom): In addition to the LUX limit, the regions measured from annual modulation in CoGeNT (light red, shaded) are shown, along with exclusion limits from low threshold re-analysis of CDMS II data (upper green line), 95% allowed region from CDMS II silicon detectors (green shaded) and centroid (green X), 90% allowed region from CRESST II (yellow shaded), and DAMA/LIBRA allowed region , as interpreted by (gray shaded).
Authors: Peter Barrow and Pedro Machado
© INvISIBLES PROJECT 2011 - 2012