Paper of the month: Planck 2015 results. XX. Constraints on inflation
April 7, 2015 by tiinatimonen
Today, the Universe is expanding and is believed to have done so for all of its history. One piece of evidence for this is the increasing redshift of distant galaxies: The more distant a galaxy is from us, the more its emitted light is stretched to larger wavelengths, in short, looks redder. This stretching of the light is, in turn, caused by the expansion of space itself, to a degree correctly predicted by Einstein's theory of general relativity.
Because of this expansion of the Universe, in the past the Universe was much smaller, denser, and hotter than it is today. At some point it was even so hot that atomic nuclei could not bind electrons, meaning that photons could only travel a small distance before hitting one of these free electrons. In other words, the Universe was opaque. As the Universe cooled down, it became transparent and the last light that was emitted by the glow of the hot early Universe before this time is what we see today as the cosmic microwave background. At the time when the Universe became transparent, which occurred when it was about 380000 years old, this light emitted had much shorter wavelengths than it has today. But like the light of the much younger galaxies, this afterglow of the hot young Universe was stretched by the expansion of space. By measuring the brightness of this light at different wavelengths, the temperature of the early Universe in different directions can be measured.
The Planck satellite is (as its predecessors WMAP and COBE), a space observatory that is dedicated to surveying and measuring in detail the cosmic microwave background.
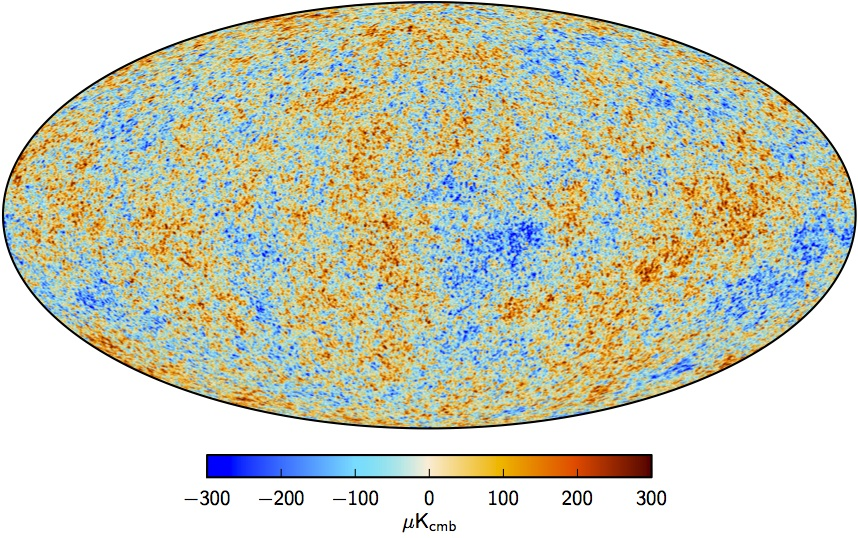
Figure 1. A map of the temperature fluctuations of the cosmic microwave background, as seen by the Planck Satelite. What is shown is not the absolute temperature, but the difference between the measured temperature and the average temperature.
Figure 1 shows a temperature map of the sky as seen by the Planck satellite, where it can be seen that the cosmic microwave background does not have the same temperature in every direction. These differences in temperature were expected because of small fluctuations in the early Universe before it became transparent. The problem with these measured temperature differences is that they look much too similar in all directions. In the very early Universe, long before it became transparent, small random differences in the density of the plasma should have arisen. If one calculates how these differences should show up in the cosmic microwave background, it turns out that different parts of the sky should look much more different because of the fluctuations had lots of time to develop differently in separate parts of the sky. Only if fluctuations had been extremely tiny in the very early Universe, could today´s observations be accurately described. A soluction to this problem is the idea of inflation, i.e. that the Universe went through a phase of rapidly accelerating expansion. Because of this accelerating expansion, parts of the Universe that are no longer in contact with each other, had been in contact before inflation.
At the same time, during this phase of accelerated expansion, gravitational waves were produced. These will produce a specific signature in the cosmic microwave background, in its temperature, but in particular in its polarization. The type of polarized light that can only be produced by such gravitational waves in the early Universe is called the B-modes of polarization. Unfortunately, after this time, there are many other sources of polarization in the cosmic microwave background in the Universe that can mimic the B-modes produced by gravitational waves. Among these sources is scattering of the background light by gravitational lensing, or in particular, by dust in our galaxy.
The BICEP2 experiment is an observatory situated at the south pole that is optimized to measure the B-modes of the polarization of the cosmic microwave background. In 2014, BICEP2 released a paper, where they claimed observation of B-mode polarization of the cosmic microwave background. The parameter that is usually measured to characterize the strength of the B-modes is called the tensor-to-scalar-ratio, and is denoted by r. In the 2014 publication of the BICEP2 experiment, they measured a relatively high value of r 0.15. However, the interpretation of this high value as coming from gravitational waves caused by inflation was cast into doubt, since it was possible that they underestimated the contribution from dust in our galaxy.
In the article highlighted this month, the collaboration behind the Planck satellite has published measurements of the temperature and polarization of the cosmic microwave background and discusses what these measurements mean for inflation. For the paper, the full temperature data of the whole mission time of the Planck satellite and a first part of the polarization data was used.
One should note that inflation is not a single physical model, but instead a more general idea, and there are many specific models of inflation which can be formulated. The two main quantities used to constrain different models of inflation are the spectral index ns of the scalar components of the fluctuations and the tensor-to-scalar-ratio r that was mentioned above.
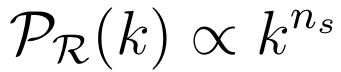
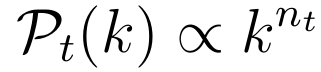
The simplest assumption is that the spectra of primordial scalar and tensor perturbations can be described by a simple power law,
 (1)
(1)
and
 (2)
(2)
According to the paper, this assumption can fit the data well and no further modifications are required. The tensor-scalar-ratio r is then simply the ratio of these two spectra, evaluated at some reference value of k.
These primordial spectra need to be translated into actual correlation functions for the light we observe today. This happens through so-called transfer functions. Here, it is important that both primordial scalar and tensor perturbations can contribute to temperature and E modes, but only tensor perturbations can contribute to B modes in a first approximation. This is where the so-called weak lensing and galactic dust will play a role.
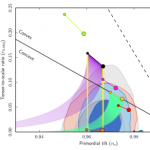
Although the paper contains many results, arguably the most interesting ones are the ones concerning ns and r, and in the final section the Planck data are combined with that from BICEP2/ KECK Array, yielding improved constraints. Figure 2 shows the allowed values of ns and r together with the predictions of a selection of different models of inflation. From these results one can conclude that some models of inflation, such as natural inflation and V ∝ Ø2 are now being disfavored, while many others are still compatible with the data.
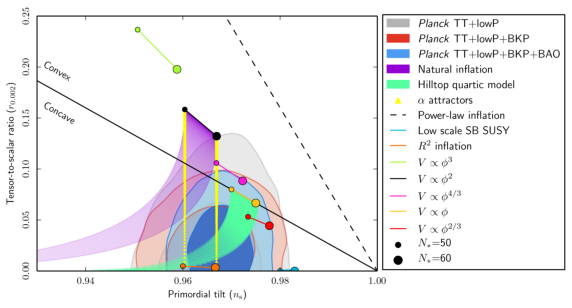
Figure 2. Constraints from different data combinations, where BKP denotes the analysis from the combined BICEP2/KECK Array and Planck data, together with the predictions of selected inflationary models.
Authors: Thomas Neder and Johannes Bergstrom
© INvISIBLES PROJECT 2011 - 2012