Paper of the month: Search for short baseline νe disappearance with the T2K near detector
Neutrino oscillations have been confirmed in many experiments in the last two decades. Almost all the observed oscillations fit quite well in the standard three neutrino picture where we have electron, tau and muon ”type or flavour” neutrinos. Oscillations can occur as the flavour of the neutrino does not correspond to a distinct massive particle. The distinct mass-state neutrinos are the physical particles that move freely through space and are made up of a combination of electron, tau and muon flavour neutrinos. So if you observe a neutrino in flight, you might observe the muon component one time, and the electron component the next. It is this change of neutrino flavour over time that we call neutrino oscillations.
December 16, 2014 by tiinatimonen
The physics describing these oscillation are fully explained with six measurable parameters. Some of these parameters are measured by the T2K experiment in Japan. Among these six parameters, there are two squared mass differences (which represent how heavy each mass state is in respect to the others), three angles (which correspond to how much of each flavour is in each mass state) and one CP violating phase. However, not all experiments agree. There are two experiments, SAGE and GALLEX, which have seen a substantial deficit of electron neutrinos originating from intense radioactive sources at energies much larger than the standard neutrino mass differences. These anomalies can be accommodated by expanding the standard picture by one sterile neutrino, i.e. expanding the parameter space by one more mass difference and three more mixing angles, one for each active neutrino flavour. These new particles are referred to as sterile neutrinos, as they cannot have weak interactions as the standard ”active” neutrinos or we would have dis- covered them already.
In this paper, new data from the near detector of T2K experiment are used to analyse the νe spectra in the framework of an additional sterile neutrino. It has to be noted that other anomalies of neutrino oscillations have been seen in the LSND and MiniBOONE experiments, as well as in the reactor experiments, but these anomalies can not be explained by adding one sterile neutrino because of the tension between appearance and disappearance data. In the absence of a consensus candidate model, the authors believe that an analysis of the most simple 3+1 extension can give some insights of the existing anomalies.
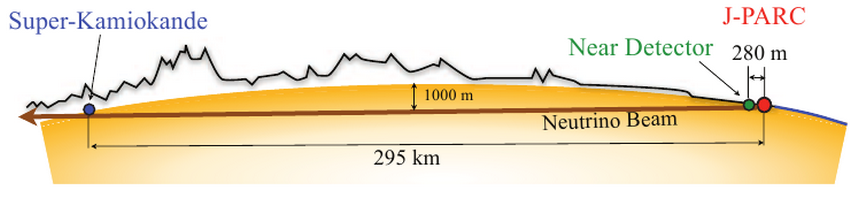
Figure 1: Passage of the muon neutrino beam from J-PARC to Super K
T2K (Tokai to Kamioka) is a long baseline experiment, with the goal to measure the neutrino oscillations parameters. The pions are produced in the collisions of the proton beam with a carbon target, and they quickly decay to muons and muon neutrinos. At the end of decay pipe, muons, kaons and other heavy particles are stopped by a second layer of graphite, but the neutrinos pass through this layer. The intensity and direction of the beam are controlled by the Interactive Neutrino GRID (INGRID) near detector, which is placed at 280 m away from the source, in the center of the beam. Another detector, ND280 is also placed at 280 m, but 2.5 degrees off the neutrino beam axis. The further detector, Super K, which is the primary physics detector, is at 275 km, also 2.5 degrees of axis. The angle is set to peak the neutrino energy around 500 MeV. The near detector ND280 can look for the existence of a heavier sterile neutrino. The result presented in the paper are based on data taken from January 2010 to May 2013.
A standard procedure that scientists use for determination of the un- known parameters, as well as seeing if a given theory fits well with observational data is called ”minimizing the χ2 function”. The χ2 function describes disagreements between real data and the predicted ones. If you take a theory and compare its predictions to that of an experiment, if the theory and experiment agree the χ2 is a small number, but if the theory predicts a lot of events that are not observed, then the associated χ2 is large. The best fit value is obtained by looking for the smallest value of the χ2, hence ”mini-mizing the χ2 ”, as this by definition is the point which the theory and the experiment agree best.
If you look at Figure 2, we see the black dots representing the data ob- served in the T2K detector. The black bars represent the ”errors” or ”uncertainties” in the measurements. As we can see the blue line representing how well a theory with and extra sterile neutrino
ts the data better than the red dashed line which does not have any extra particles or physics at work. The best
t occurs for maximal mixing and mass di
erence of 2:05 eV. In this analysis mixing of the sterile neutrino with muon neutrino is set to 0, but the exclusion curve does not depend much on this value, as long as it is in the region allowed by other experiments.
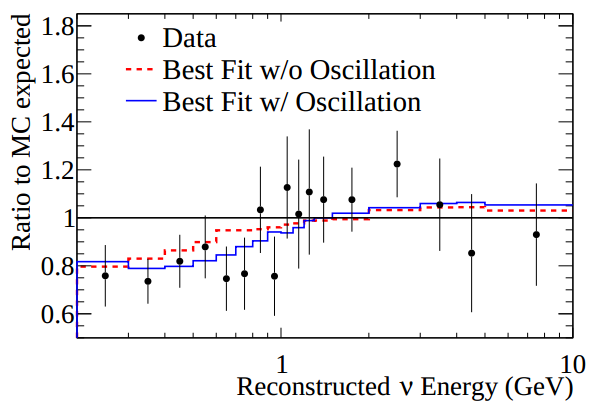
Figure 2: Ratio of the predicted over measured data for both oscillations with the parameters value obtained from the fit (solid blue), and non-oscillation case (red dashed line). Systematic and statistical errors are also shown on the plot as the vertical black bars on each data point.
However, this does not mean we can declare we have discovered a new particle! If you look again at the data in Figure 2, although the blue curve does i
t better, the red curve is not a bad
t itself. In fact you could easily believe that the red curve
ts
ne, with one or two points that are statistically a bit low due to random chance. To clarify not just if it
ts better, but how signi
cant is the
t, physicists use a concept called a p-value of a hypothesis. This answers the question how likely is it that we would get such data if a hypothesis is actually true, taking into account random uctuations. So we can ask what is the p-value of the no-oscillation hypothesis (i.e. what is the probability of obtaining the observed data (or a more extreme result) when there is no extra sterile). The value obtained by T2K in this analysis is 0.085 or 8.5%, and therefore not statistically signi
cant to reject the null hypothesis.
Although the results from T2K near detector may point to the existence of a sterile neutrino, we require more than one experiment, and at a much higher signi
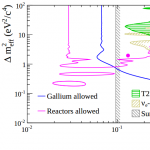
cance to declare a discovery. This concept of multiple experiments showing a signal is very important in physics, as it prevents accidental claims before we have sucient evidence to back them up. Figure 3 shows the allowed parameter space by the reactor and Gallium anomalies as well as the T2K best
t by a green star. More data will reduce the statistical uncertainty and could allow T2K to improve the short baseline data sterile neutrino analyses.
.png)
Figure 3: Summary of the exclusion curves obtained from T2K and other experiments available in the literature. The allowed regions from gallium and reactor anomalies are also illustrated.
Text by Marija Kekic (IFIC) and Mark Ross-Lonergan (IPPP)
© INvISIBLES PROJECT 2011 - 2012